| .github | ||
| data | ||
| doc | ||
| icons | ||
| roentgen | ||
| scheme | ||
| test | ||
| .gitattributes | ||
| .gitignore | ||
| LICENSE | ||
| README.md | ||
| requirements.txt | ||
| roentgen.py | ||
Röntgen (or Roentgen when ASCII is preferred) project consists of
- simple Python OpenStreetMap renderer (see usage, renderer documentation),
- set of CC-BY 4.0 icons that can be used outside the project.
The idea behind the Röntgen project is to show all the richness of the OpenStreetMap data: to have a possibility to display any map feature represented by OpenStreetMap data tags by means of colors, shapes, and icons. Röntgen is created for OpenStreetMap contributors: to display all changes one made on the map even if they are small, and for users: to dig down into the map and find every detail that was mapped.
Unlike standard OpenStreetMap layers, Röntgen is a playground for experiments where one can easily try to support proposed tags, tags with little or even single usage, deprecated tags.
Röntgen is intended to be highly configurable, so it can generate precise but messy maps for OSM contributors as well as pretty and clean maps for OSM users, can use slow algorithms for some experimental features.
Usage
To get SVG map, just run
python roentgen.py render -b <lon1>,<lat1>,<lon2>,<lat2>
(e.g. python roentgen.py render -b 2.284,48.86,2.29,48.865). It will automatically download OSM data and write output map to out/map.svg. For more options see Map generation.
Map features
Röntgen features:
- detailed icons to display subtypes like power tower design,
- can display multiple icons for one entity to cover more features,
- use color to visualize
colourand other features like plant types, - display privitive 3D shapes for buildings,
- display directions with gradient sectors,
- use width to display roads.
Simple building shapes
Simple shapes for walls and shade in proportion to building:levels, building:min_level, height and min_height values.

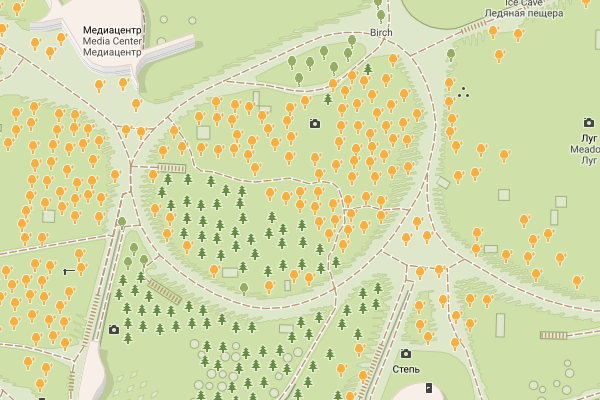
Trees
Visualization of tree leaf types (broadleaved or needleleaved) and genus or taxon by means of icon shapes and leaf cycles (deciduous or evergreen) by means of color.
Viewpoint and camera direction
Visualize direction tag for tourism=viewpoint and camera:direction for man_made=surveillance.

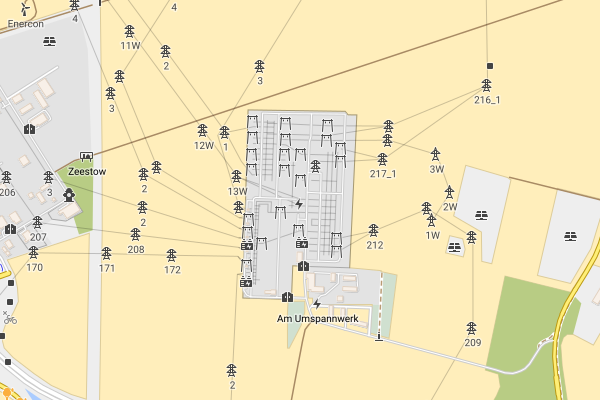
Power tower design
Visualize design values used with power=tower tag.

Emergency

Japanese map symbols
There are special symbols appearing on Japanese maps.

Icon set
If tag is drawable it is displayed using icon combination and colors. All icons are under CC BY license. So, do whatever you want but give appropriate credit. Icon set is heavily inspired by Maki, Osmic, and Temaki icon sets.
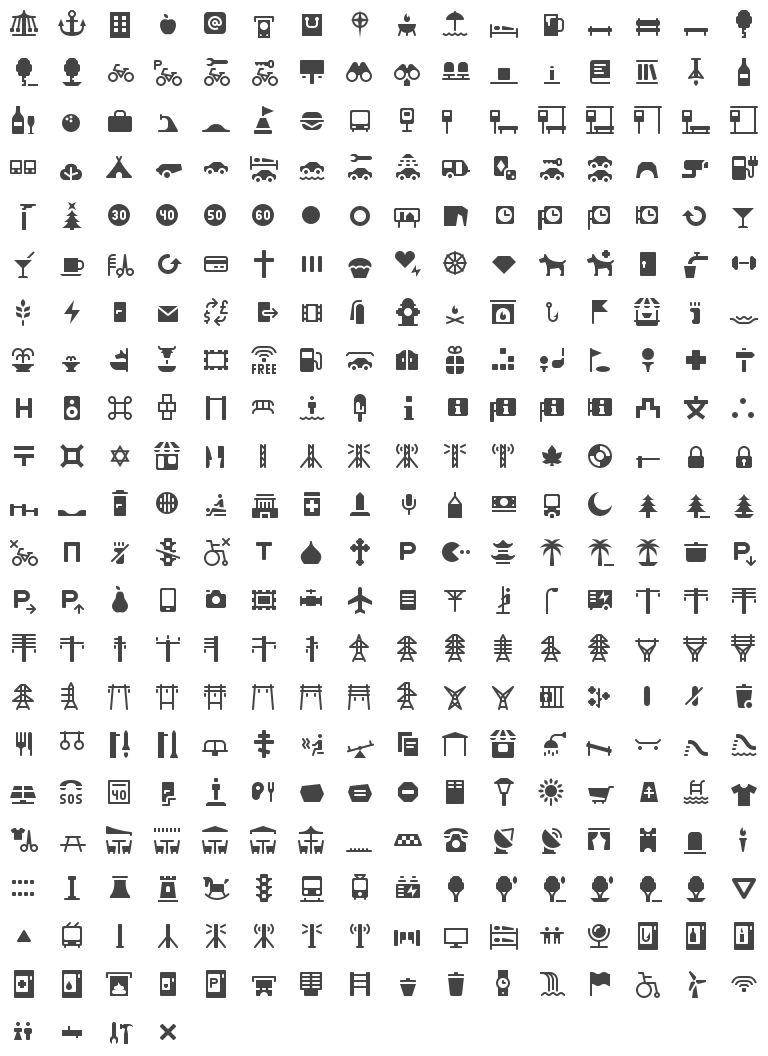
Feel free to request new icons via issues for whatever you want to see on the map. No matter how frequently the tag is used in OpenStreetMap since final goal is to cover all tags. However, common used tags have priority, other things being equal.
Generate icon grid and sets of individual icons with python roentgen.py icons. It will create out/icon_grid.svg file, and SVG files in out/icons_by_id directory where files are named using shape identifiers (e.g. power_tower_portal_2_level.svg) and in icons_by_name directory where files are named using shape names (e.g. Röntgen portal two-level transmission tower.svg). Files from the last directory are used in OpenStreetMap wiki (e.g. File:Röntgen_portal_two-level_transmission_tower.svg).
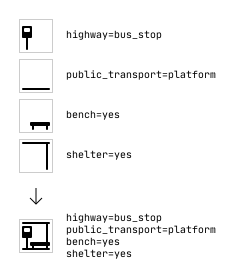
Icon combination
Some icons can be combined into new icons.
Map styles
All tags style
Options: --show-missing-tags --overlap 0.
Display as many OpenStreetMap data tags on the map as possible.
Pretty style
Options: --draw-captions main --level overground.
Display only not overlapping icons and main captions.
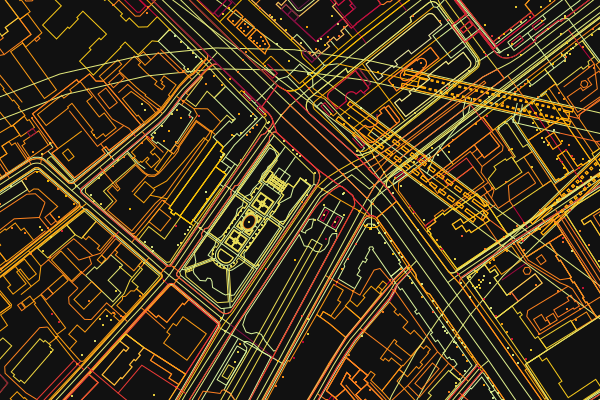
Creation time mode
Visualize element creation time with --mode time.
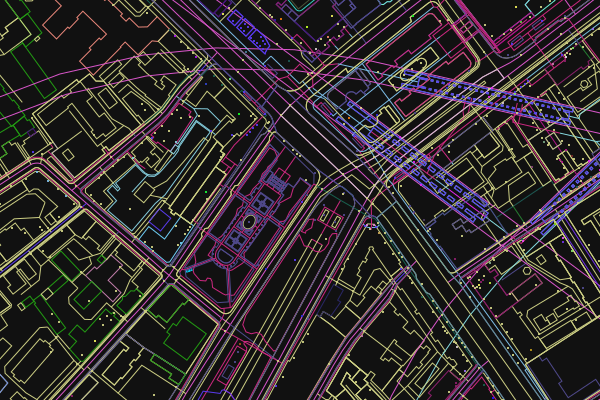
Author mode
Every way and node displayed with the random color picked for each author with --mode user-coloring.
Installation
Requirements: Python (at least 3.8).
To install all packages, run:
pip install -r requirements.txt
Map generation
Command: render.
There are simple Python renderer that generates SVG map from OpenStreetMap data. You can run it using:
python roentgen.py render \
    -b ${LONGITUDE_1},${LATITUDE_1},${LONGITUDE_2},${LATITUDE_2} \
    -o ${OUTPUT_FILE_NAME} \
    -s ${OSM_ZOOM_LEVEL}
Example:
python roentgen.py render -b 2.284,48.86,2.29,48.865
Arguments
| Option | Description |
|---|---|
-h, --help |
show this help message and exit |
-i, --input |
input XML file name or names (if not specified, file will be downloaded using OpenStreetMap API) |
-o, --output |
output SVG file name, default value: out/map.svg |
-b, --boundary-box |
geo boundary box, use space before "-" if the first value is negative |
-s, --scale |
OSM zoom level (may not be integer), default value: 18 |
--cache |
path for temporary OSM files, default value: cache |
--labels |
label drawing mode: no, main, or all, default value: main |
--overlap |
how many pixels should be left around icons and text, default value: 12 |
--mode |
map drawing mode, default value: normal |
--seed |
seed for random |
--level |
display only this floor level |
Tile generation
Command: tile.
| Option | Description |
|---|---|
-h, --help |
show this help message and exit |
-c, --coordinates |
coordinates of any location inside the tile |
-s, --scale |
OSM zoom level, default value: 18 |
-t, --tile |
tile specification |
--cache |
path for temporary OSM files, default value: cache |
python roentgen.py tile \
    -c ${LATITUDE},${LONGITUDE} \
    -s ${OSM_ZOOM_LEVEL}
Tile will be stored as SVG file to out/tiles/tile_<zoom level>_<x>_<y>.svg, where x and y are tile coordinates.
Example:
python roentgen.py tile -c 55.7510637,37.6270761 -s 18
will generate SVG file out/tiles/tile_18_158471_81953.svg.
MapCSS 0.2 generation
Command: mapcss.
python roentgen.py mapcss will create out/roentgen_icons_mapcss directory with simple MapCSS 0.2 scheme adding icons from Röntgen icon set to nodes and areas: .mapcss file and directory with icons.